The $150,000 cliff: what a loan-guarantee rule does to lending
AbstractThe SBA guarantees 85% of a 7(a) loan up to $150,000 and 75% above it, so one extra dollar raises the bank's share of the risk from 15% to 25%. Using all 1.69 million loans since 1991, lenders pile about 26,200 extra loans just under the cutoff. The pile appeared within a year of the 2000 law that moved the cutoff from $100,000, shrank to a third when a flat 90% guarantee removed the step, and replicates Bachas, Kim and Yannelis (2021) with an elasticity of 3.9 against 4.6. Loans at the line are not measurably riskier once that sorting is accounted for, and a default model trained in one guarantee era underpredicts the next (6.5% against 7.9%).
Keywordsloan guarantees; bunching; regression discontinuity; credit risk; small business lending
JEL G21 · G28 · H81 · C21
One-page brief (PDF)Code and full results on request
The question
Two questions follow from the rule. Do lenders bend loan sizes around it? And are loans at the line riskier, because the bank had less skin in the game?Bachas, Kim and Yannelis (2021) showed the bunching. This replicates it and adds performance, the 2000 move of the cutoff, and what the rule does to a model trained on its loans.
Data
The SBA's public loan-level file covers 1.69 million disbursed 7(a) loans from fiscal 1991 to 2026, joined with monthly county unemployment (BLS), the prime rate (FRED) and bank capital ratios (FDIC). Borrower names and addresses are hashed and dropped before any analysis.
The rule bites
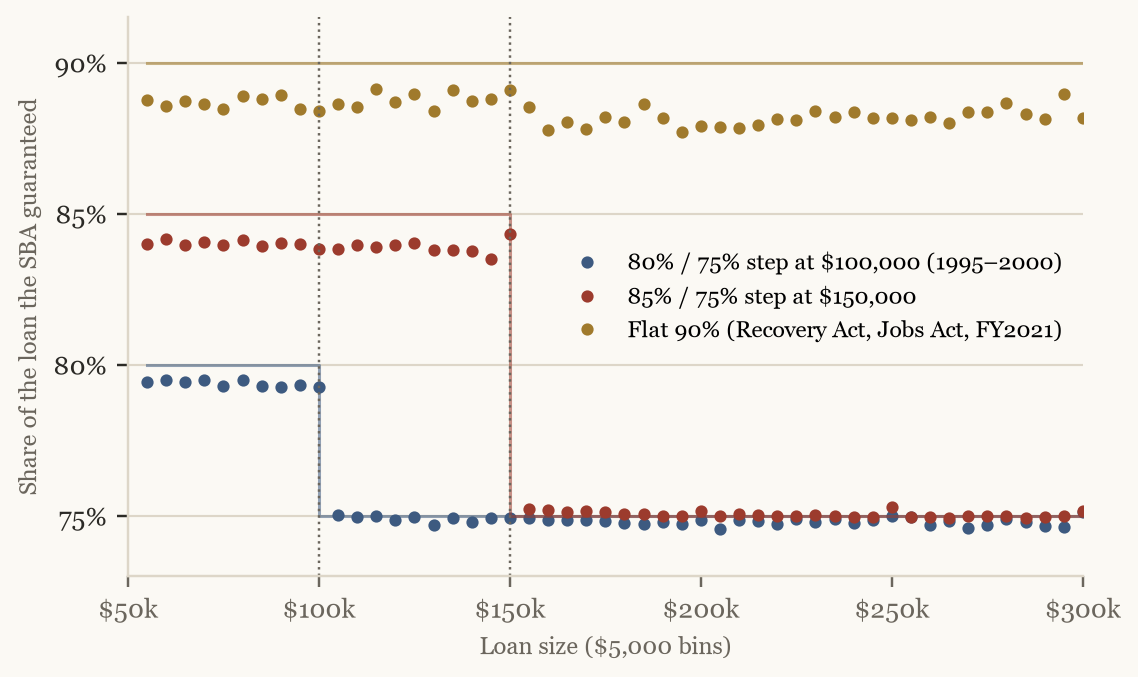
Lenders pile loans at the cutoff
About 26,200 more loans sit between $145,000 and $150,000 than a smooth distribution predicts, as many as would normally spread over about $49,000 of loan sizes (normalized excess mass 48.6, 95% interval 33.7 to 65.9). In years when a flat 90% guarantee removed the step, the pile shrinks to a third; SBA Express, which has no step, shows none; placebo cutoffs give values between −3.8 and 3.9.
The pile moved with the law
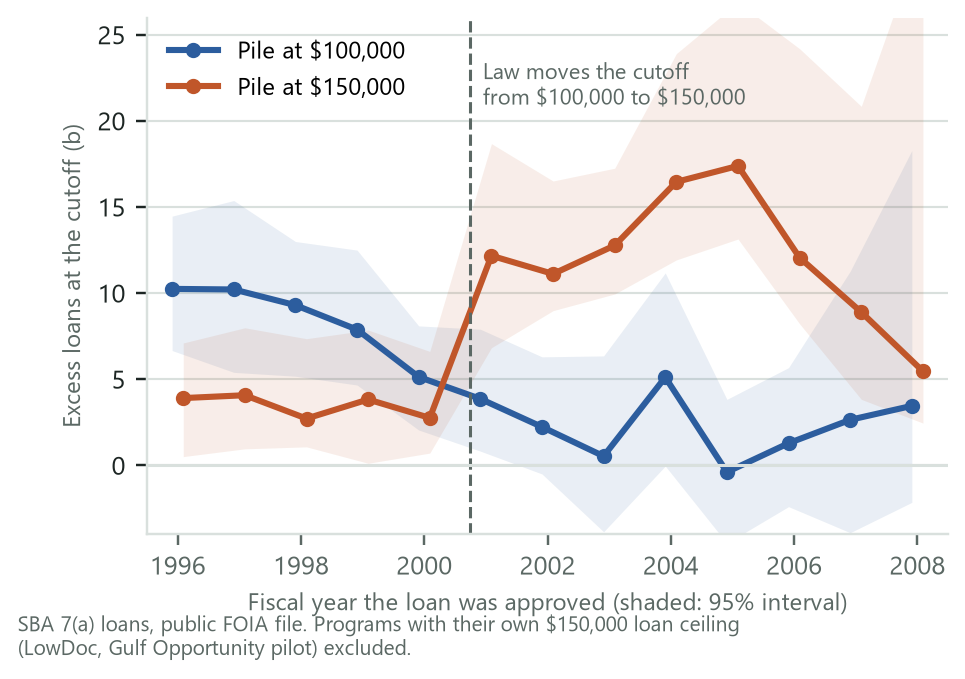
This only looks clean after a correction.first version: the pile showed up after two years before the law → LowDoc loans, capped at $150k Two SBA programs, LowDoc and a Gulf Opportunity pilot, had their own $150,000 maximum, so their loans pile at the cutoff whatever the guarantee is. Removing those 127,841 loans moved the start of the pile to the year the law changed. The note on it.
Are loans at the line riskier?
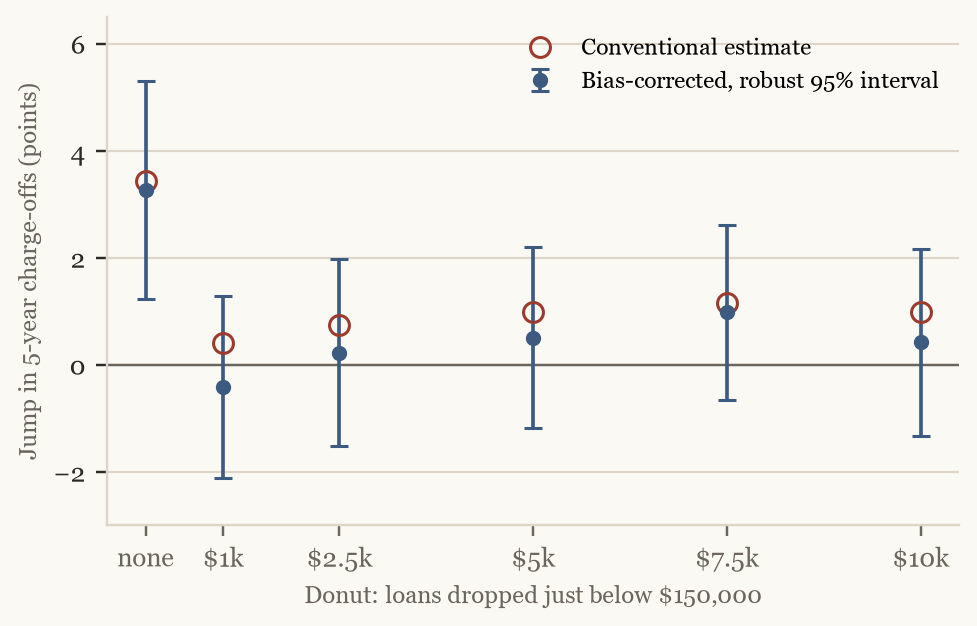
Loans at or just under $150,000 charge off 3.4 points more over five years, but that comparison is unfair: the loans pushed to the line differ from their neighbors. Setting them aside drops the gap to between 0.4 and 1.2 points, not distinguishable from zero; a difference in discontinuities against the years without the step gives 0.9 points (−1.2 to 2.9); manipulation-robust bounds are wide, from −7.7 to +19.3.
A model trained on policy-shaped data
A competing-risks model treats charge-off and early payoff as rival outcomes, with local unemployment that changes month by month. Tested on later years than it was trained on, it ranks loans with an AUC between 0.68 and 0.80, and a one-point rise in county unemployment since approval raises the odds of charge-off by about 14%. Fit on loans from the 85%/75% years, it predicts 6.5% five-year charge-offs for loans made under the 90% guarantee; 7.9% happened.A first version scored an AUC of 0.98. The loan term in the public file is rewritten after default; the model was reading the outcome.
Stress test
Over 24 months, simulated county-unemployment paths applied to the active book (about $120 billion) give an expected loss of $1.26 billion (1.05%), of which the SBA bears $0.93 billion, and a 99th-percentile loss of $1.81 billion. A 2008 replay costs 1.50% of exposure; a 2020 replay 1.81%.
Limits
Calibration depends on the horizon: close at five years, too high at two, likely because the SBA records a charge-off well after the default. The stress test uses a 5,000-loan sample of 284,179 active loans. Six rows of the policy calendar still need a primary source.
References
- Bachas, N., O. S. Kim and C. Yannelis (2021). Loan guarantees and credit supply. Journal of Financial Economics.
- Gerard, F., M. Rokkanen and C. Rothe (2020). Bounds on treatment effects in regression discontinuity designs with a manipulated running variable.
- Grembi, V., T. Nannicini and U. Troiano (2016). Do fiscal rules matter? (difference in discontinuities).
- Glennon, D. and P. Nigro (2005). Measuring the default risk of small business loans: a survival analysis approach.
- Data: SBA 7(a) and 504 FOIA file; BLS Local Area Unemployment Statistics; FRED; FDIC BankFind.
Project log
- October 2026The $150,000 cliff
Found that two SBA programs capped loans at the cutoff ($150,000), which can fake part of the result. Excluding their 127,841 loans made the migration test far cleaner. More.
- October 2026The $150,000 cliff
First results on 1.69 million SBA 7(a) loans: the pile at the cutoff, a replication of a published estimate, and no measurable difference in risk at the line.
Next
- The $150,000 cliff. Estimate how strictly each lender screens, and run the stress test on every active loan.